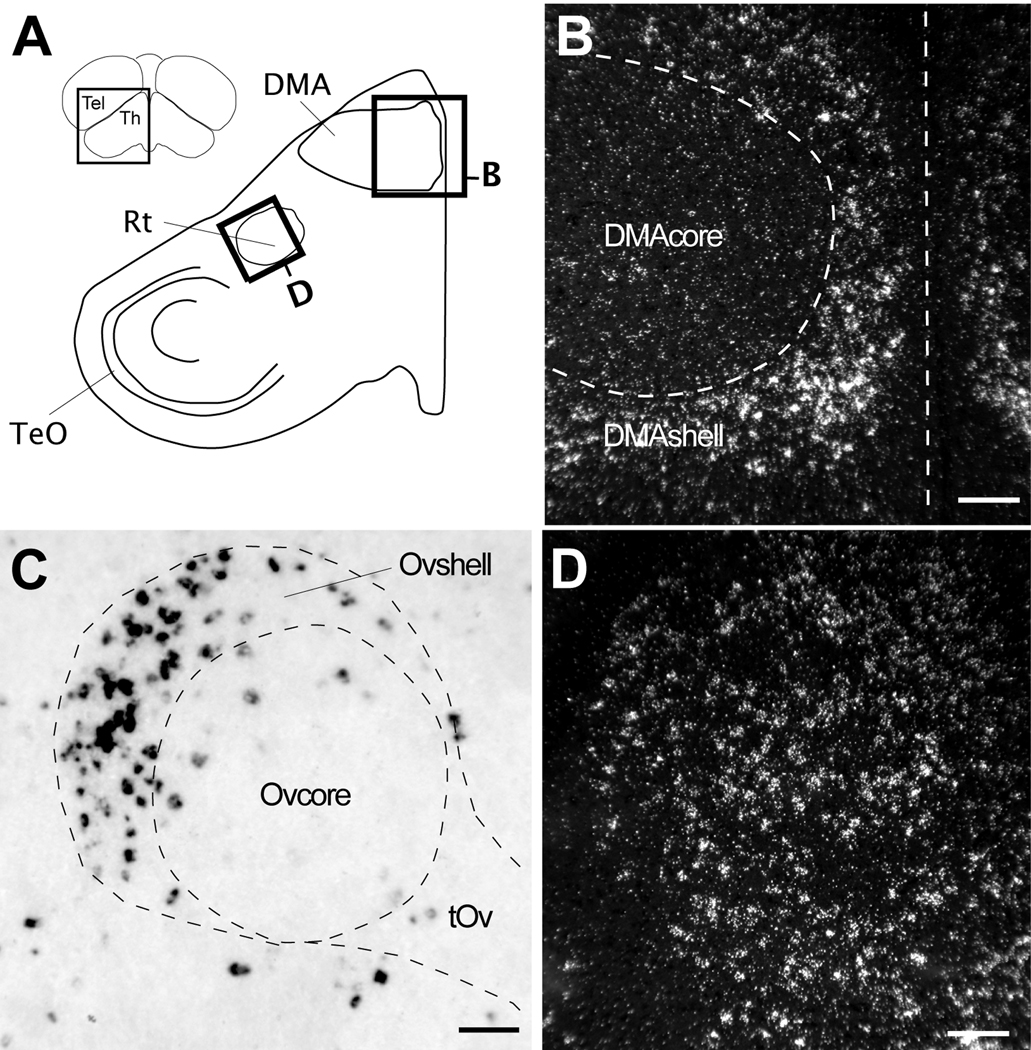
Figure 8.
Cck expression in the thalamus. (A) Camera lucida drawing of a frontal section depicting some major nuclei in the thalamus (location indicated in the section on the top left inset). Rectangles denote the locations of the photomicrographs in B and D. (B) Dark-field view in a frontal section of emulsion autoradiography showing Cck expression restricted to the shell of DMA. Dashed lines denote the approximate boundary of the DMA core based on Nissl staining and define the midline. (C) High power bright-field view from a parasagittal section through the thalamus (location indicated in Fig. 4C) showing labeled cells within the shell of nucleus ovoidalis (Ov). The dotted lines denote the approximate boundaries of the Ovcore/Ovshell and tract (tOv), based on Nissl staining. (D) Dark-field view in a frontal section of emulsion autoradiography depicting Cck expression in nucleus rotundus (Rt). Scale bars: 100 µm. For other abbreviations see Table 1.

