Figure 2.
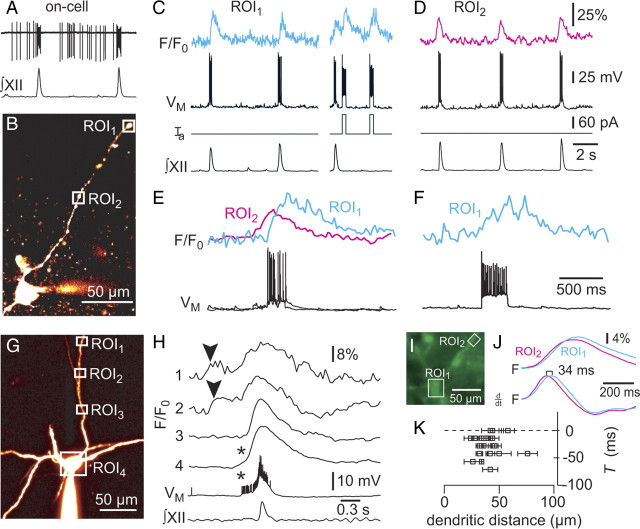
Dendritic Ca2+ measurements in preBötC neurons recorded with standard K-gluconate patch solution. A, On-cell recording and XII output. B, Image of the cell in A (Alexa 568). C, D, Dendritic Ca2+ dynamics in ROI1 (C) and ROI2 (D) with whole-cell and XII recordings. Step commands were applied while imaging ROI1 in C. Vertical calibration bars apply to C–F. E, The first cycles from C and D replotted and superimposed at higher sweep speed. F, Second evoked response from C replotted at higher sweep speed. G, Image of a different preBötC neuron (Alexa 568). H, Cycle-triggered average of somatodendritic activity. Imaging sweeps for ROIs 1–4 with membrane potential and XII output. Asterisks indicate somatic action potentials that evoked Ca2+ transients. Arrowheads (top traces) indicate negative dendritic Ca2+ latency. I–K, Ca2+ imaging from soma and dendrites. I, Epifluorescence image. J, Imaging sweeps showing raw and differentiated traces. K, Dendritic Ca2+ latency versus recording distance for 20 dendritic recording sites. Horizontal error bars indicate the length of the dendritic ROI.

