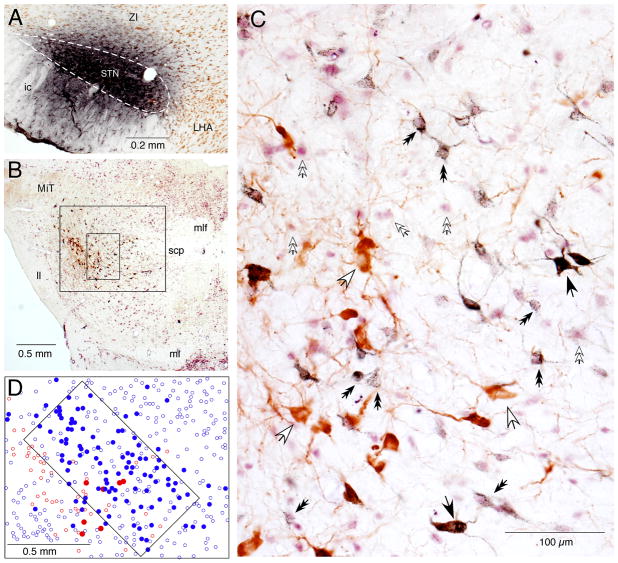
Fig. 2.
FG injection into the STN retrogradely labeled ChAT+ and ChAT− neurons in the mesopontine tegmentum. A: A photomicrograph of an FG injection site that covers most of the STN, outlined by a dashed line, with little spreading to the ZI. B and C: Low (B) and high (C) magnification photomicrographs of a mesopontine tegmentum section stained with FG (stained dark-blue), ChAT (brown), and NeuN (purple). C: The high magnification view shows the small rectangular area marked in B, in which FG+/ChAT+ (some are marked by large black arrows), FG−/ChAT+ (large white arrows), FG+/NeuN+ (small black double headed arrows), and FG−/NeuN+ (small white double headed arrows) neurons are visible. D: A drawing of the area marked by the large box in B shows the distribution of FG+/ChAT+ (filled red dots), FG−/ChAT+ (open red dots), FG+/NeuN immunoreactive (filled blue dots), and FG−/NeuN+ (open blue dots) neurons. The area marked with a tilted rectangular box contains a large number of FG+/NeuN+ neurons (details in Results).

