Fig. 5.
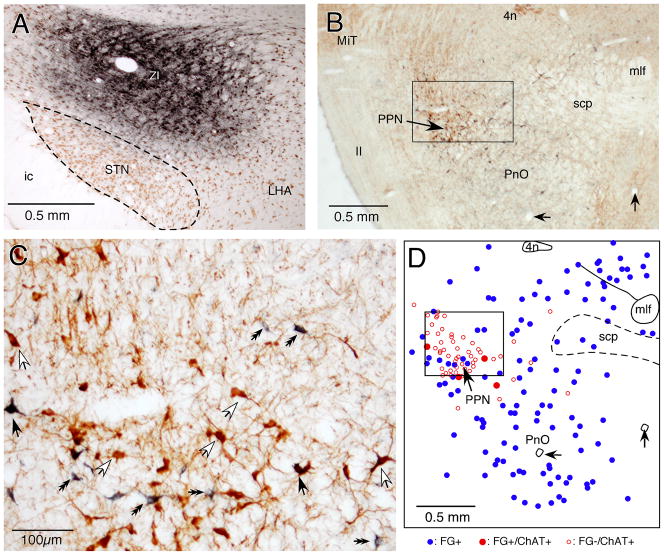
FG injection into the ZI retrogradely labeled ChAT+ and ChAT− neurons in the mesopontine tegmentum. A: A photomicrograph of an FG injection site that covers a large part of the ZI. B and C: Low (B) and high (C) magnification photomicrographs of a mesopontine tegmentum section stained with FG (stained dark-blue) and ChAT (brown). C: The high magnification view shows the small rectangular area marked in B, in which FG+/ChAT+ (some are marked by large black arrows), FG−/ChAT+ (large white arrows), and FG+/ChAT− (small black double headed arrows) neurons are visible. D: A drawing of the section shown in B shows the distribution of FG+/ChAT+ (filled red dots), FG−/ChAT+ (open red dots), and FG+/ChAT− (filled blue dots) neurons. Two small arrows point to blood vessels that were drawn in D as location references.

