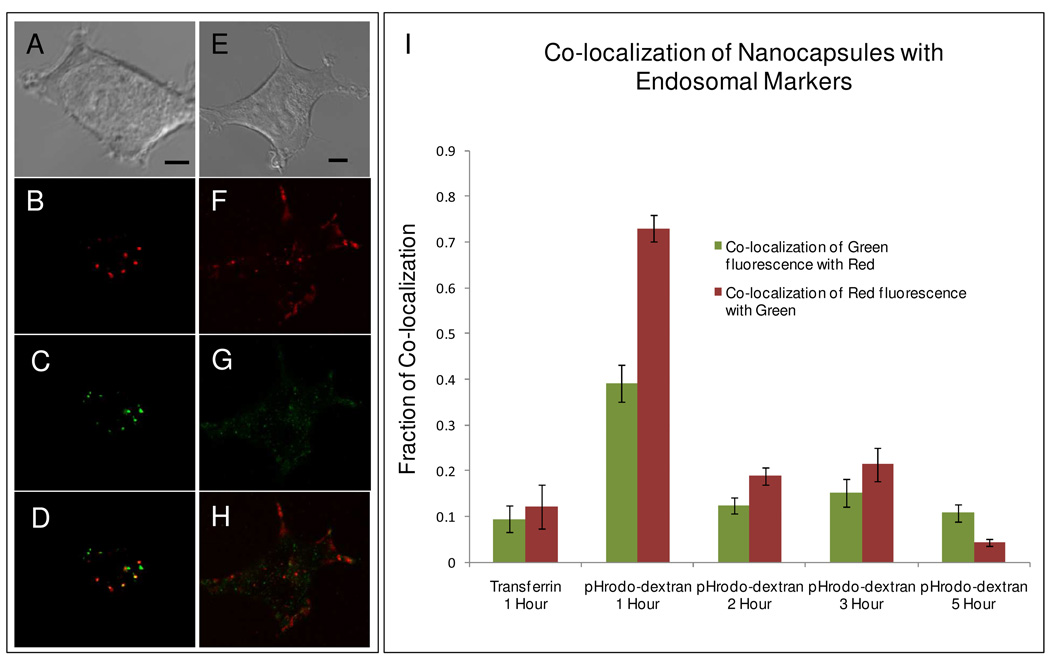
Figure 1. Co-localization study of lipid nanocapsules with endosomal markers.
Images of HEK 293 cells that were loaded for 1 hour with 100-nm-diameter 9:1 DPPC:DOPC+4mol% DiD nanocapsules and endosomal markers (A–D) pHrodo-dextran and (E–H) transferrin-Alexa 488. The cells were then washed and imaged immediately. Red fluorescence is from DiD and green fluorescence is from the endosomal marker. Scale bar represents 4 µm. (I) Histogram plot of Mander’s coefficient displaying co-localization of lipid nanocapsules with the respective endosomal markers. Again, cells were loaded with lipid nanocapsules and endosomal markers for one hour, washed, then imaged immediately and then 2–5 hours after the start of incubation. For each case 30–35 cells were imaged for data collection.

