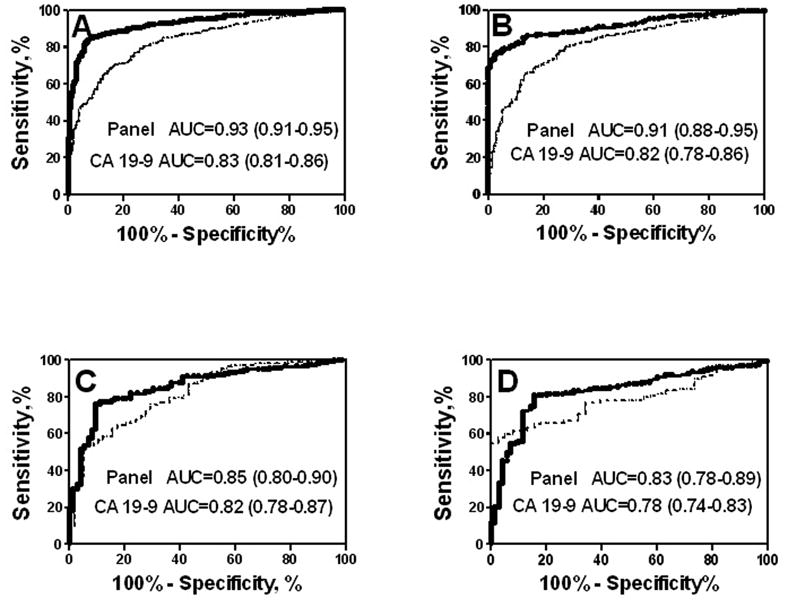
Figure 1. Receiver operator characteristic curves (ROC) for diagnosis of PDAC vs. Healthy controls and Benign cases.

A,B, The diagnostic performance of the CA 19-9, ICAM-1, OPG combination (solid line) and CA 19-9 alone (dotted line) for the discrimination of PDAC vs. Healthy in the training set (A) and in the independent validation set (B). C,D, The diagnostic performance of the CA 19-9, CEA, TIMP-1 combination (solid line) and CA 19-9 alone (dotted line) for the discrimination of PDAC vs. Benign disease in the training set (A) and in an independent validation set (B). Areas under curve (AUC) with 95% CI are presented.
