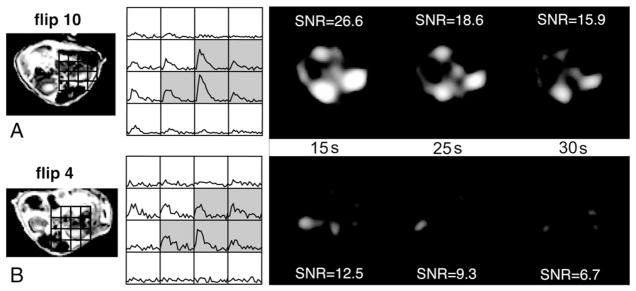
Fig. 1.
T2-FSE image, dynamic lactate curves and lactate images at three time points (15, 25 and 30 s) of the kidney region for two control mice scanned with either a 4° (A) or a 10° (B) flip angle. For the 25° flip angle, SNR values were 26.4, 17.8 and 11.8 for the 15-, 25- and 30-s time points, respectively. The gray shading represents the voxels considered part of the kidney region.

