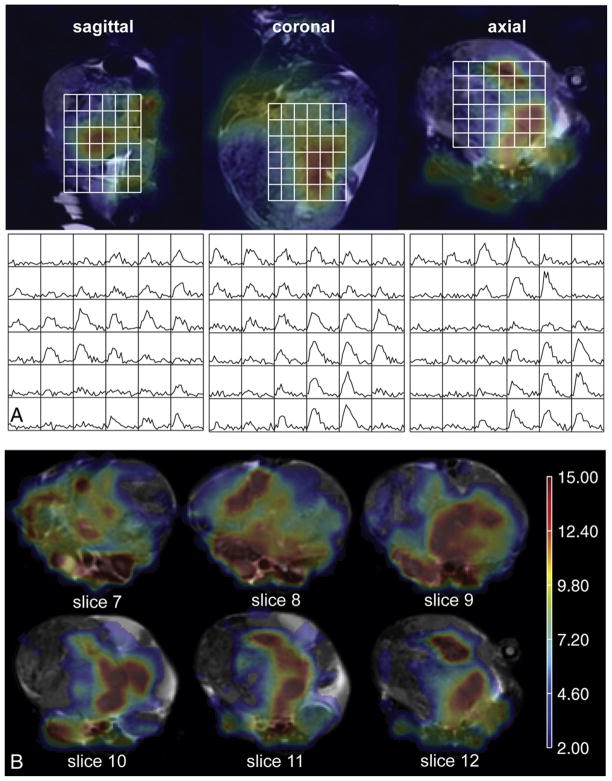
Fig. 6.
Heterogeneous distribution of lactate in a TRAMP mouse with advanced disease. (A, left to right) Sagittal, coronal and axial planes of 13C lactate images 25 s after 13C pyruvate injection overlaid on T2-FSE anatomical images and corresponding dynamic lactate curves. (B) Multiple axial slices through various depths of the tumor with MLS overlay.

