
Fig. 7.
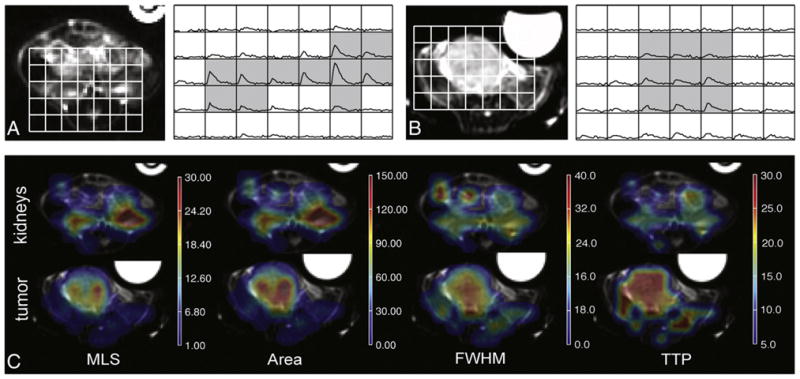
Differences in 13C dynamic lactate curves between kidney and tumor regions. (A, B) Axial T2-FSE anatomical images and corresponding dynamic curves of the kidneys (A) and the tumor (B) for a representative TRAMP mouse with advanced-stage disease. The gray shading demonstrates the voxels from which parameters were calculated for each region. (C) MSL, area, FWHM and TTP maps for the same kidney region (top) and tumor region (bottom). The asymmetry in MSL and area maps between the two kidneys is due to the positioning of the mouse within the scan plane and to partial voluming effects, as the majority of the left kidney and most elevated lactate signal are located in a superior slice.