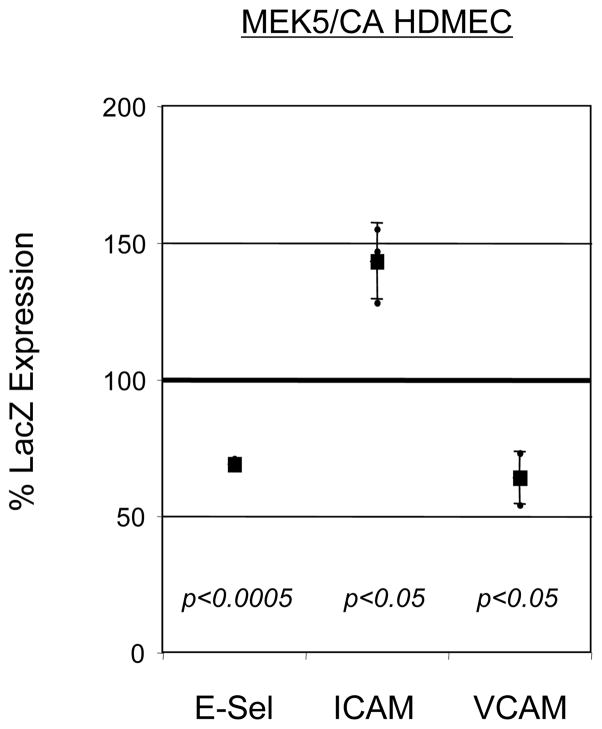
Figure 5. Alteration of TNF-induced Adhesion Molecule Expression in MEK5/CA HDMEC Cell Line.
LacZ and MEK5/CA HDMEC were stimulated with 2 ng/ml human TNF for either 4 (E-selectin) or 24 (ICAM-1 and VCAM-1) hours, when optimal protein expression is seen. Cells were collected and immunostained with FITC-conjugated, antigen-specific monoclonal antibodies and analyzed by flow cytometry. Percent MEK5/CA surface adhesion molecule expression compared to LacZ control (“% LacZ Expression”) was calculated as follows: ((Corrected MFI(MEK5/CA HDMEC)/Corrected MFI(LacZ HDMEC))*100), +/− SD. Statistical comparison of the means of the Corrected MFI for LacZ HDMEC vs. MEK5/CA HDMEC was done using a Ratio Paired t-test. Data represents pooled results from three independent trials.

