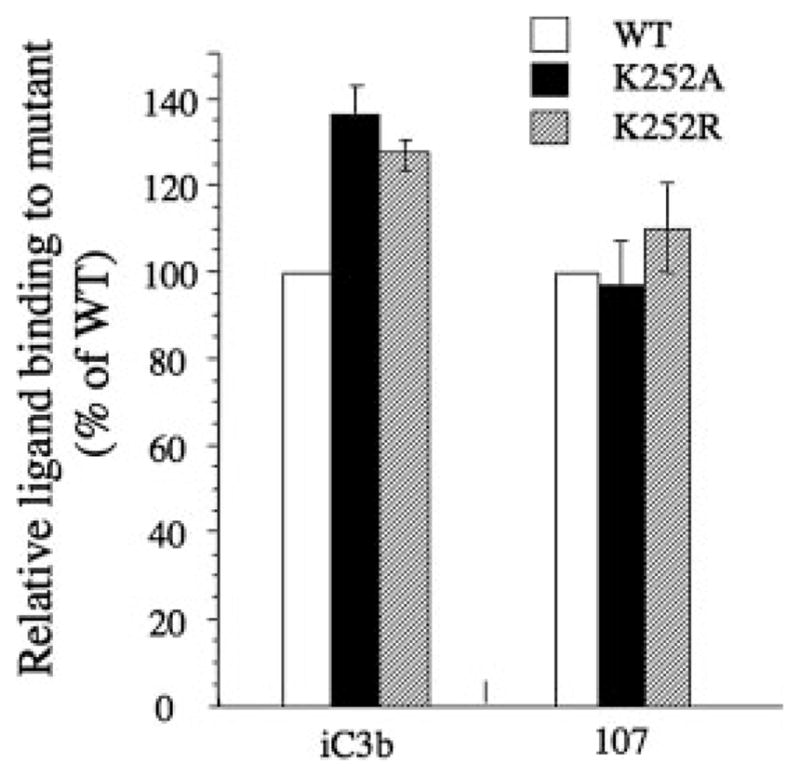
FIGURE 4.

Effect of K252A and K252R on ligand binding. Left, Histograms showing the binding of the physiologic ligand iC3b or the ligand mimic 107 to mutant CD11b/CD18 relative to that of WT (placed at 100), after correcting for receptor expression using mAb TS1/18. Each histogram represents mean ± SD of triplicate (for iC3b) or quadruplet (for 107) determinations from a representative experiment (of three performed). Details of the methods used are described in Materials and Methods.
