
Figure 5. Flow cytometry and immunoblot analysis of CXCR4 expression.
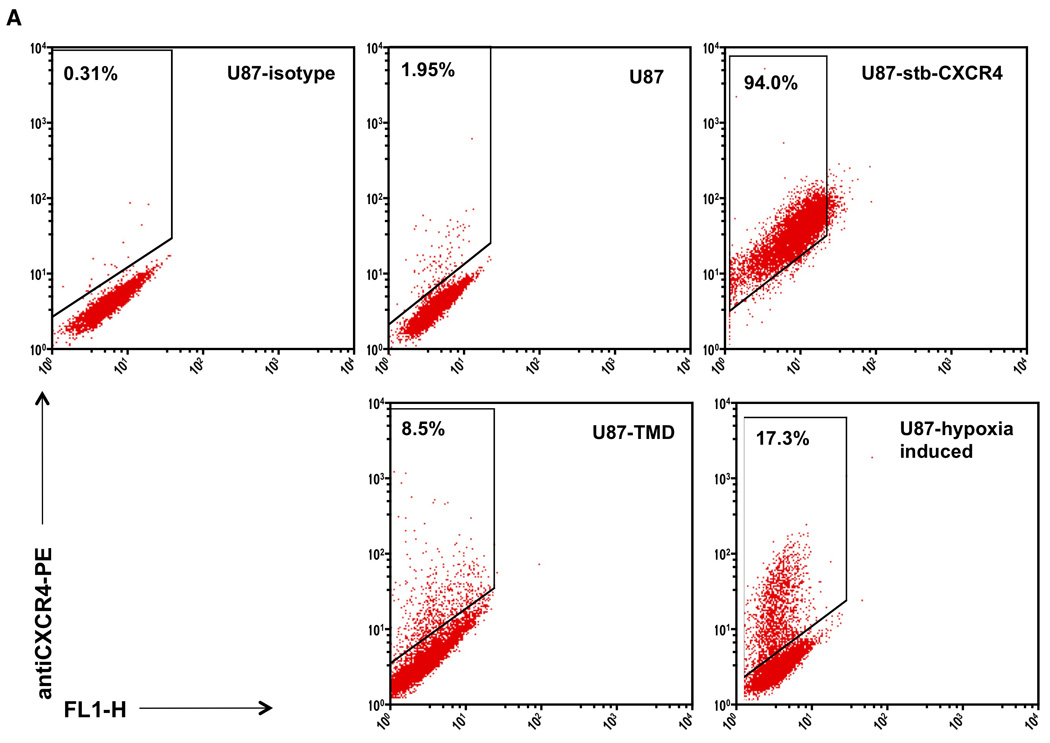
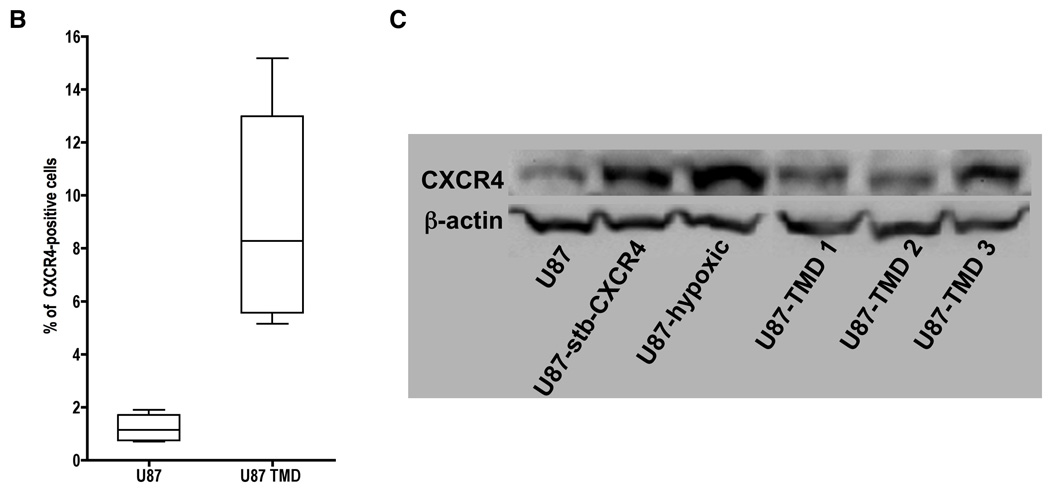
U87 cells stained with matched isotype control IgG2A-PE as well as U87, U87-stb-CXCR4 representative U87 TMD and U87-hypoxia induced cell lines stained with 12G5-PE were analyzed on a BD FACScan instrument (Panel A). Whisker graph showing the CXCR4 levels in U87-TMD cells. U87 cells from different passages were used as control (Panel B). Immunoblot analysis of CXCR4 expression in U87, U87-hypoxic and U87-TMD cells (Panel C).