
Figure 3. Dynamics of Gene Expression.
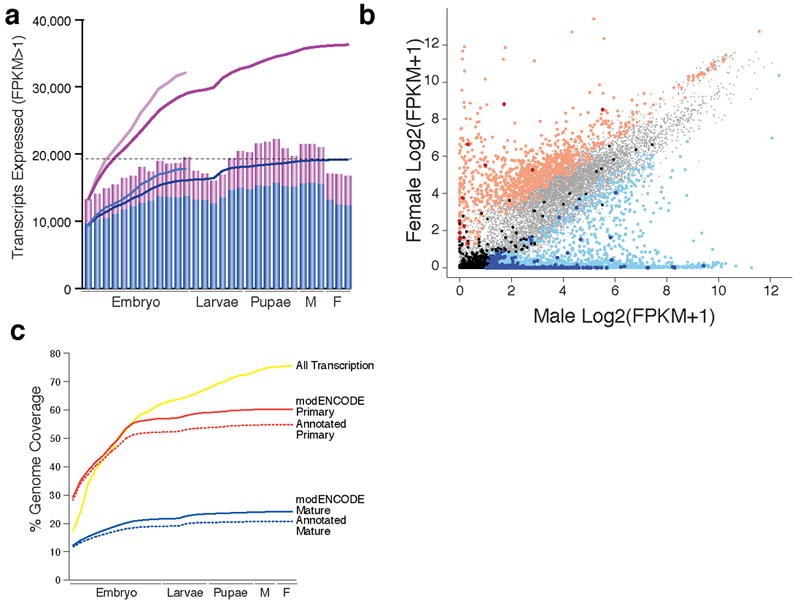
a. Transcripts expressed (FPKM>1) in the short poly(A)+ RNA-Seq data, FB5.12 (blue), modENCODE (purple). The bar graphs indicate the number of transcripts expressed in each sample (Supplementary Table 1), and the lines, the cumulative number of expressed transcripts. The lighter blue and purple lines indicate the cumulative number of transcripts expressed in the embryonic Total RNA-Seq samples. The horizontal dotted lines indicate the number of expressed previously annotated transcripts. b. Scatter plot of sex-biased gene expression. light red: female-biased annotated (n=960), dark red: female-biased NTRs (n=12), light blue: male-biased annotated (n=2,401), dark blue: male-biased NTRs (n=431), light grey: unbiased annotated (n=8,217), black: unbiased NTRs (n=136). c. Genome Coverage. For each developmental sample, the short poly(A)+ reads were used to estimate the percent of the genome covered using a cutoff of two reads. The mature and primary transcripts were inferred for the previously FB5.12 (dotted lines) and modENCODE (solid lines) gene models.