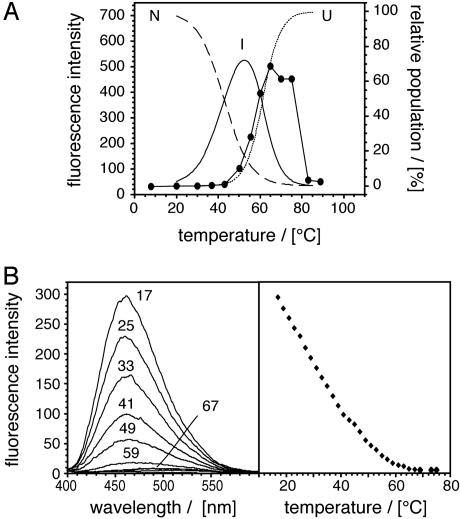
Fig. 3.
Amyloid formation does not correlate with the population of partially folded species. (A) Overlay of the experimental data from Fig. 1 (filled symbols) with a fit of the data displayed in Fig. 2 B and F to define the population of the various monomeric AMB states: native (N, broken line), intermediate (I, continuous line), and unfolded AMB (U, dotted line). (B) Temperature dependence of the ANS fluorescence induced by AMB. (Right) Fluorescence reading at 460 nm.

