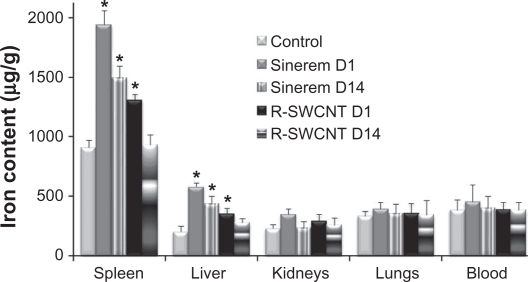
Figure 5.
Iron content in μg/g of spleen, liver, kidneys, lungs, and blood for control, USPIO (day 1 and day 14) and raw SWCNT (day 1 and day 14) groups.
Note: Asterisks indicate statistically different values from the control group (P < 0.05).
Abbreviations: R, raw; SWCNT, single-walled carbon nanotubes; D1, day 1; D14, day 14.

