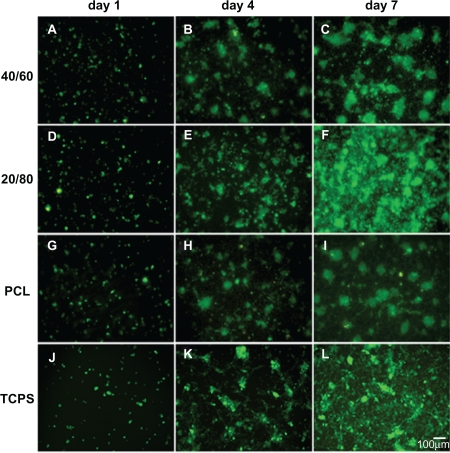
Figure 5.
Fluorescent micrograph of mRPC density on CS-PCL/PCL (40/60) (A–C), CS-PCL/PCL (20/80) (D–F), PCL (G–I) nanofibrous scaffolds, and the cell culture plates (TCPS) (J–L) on day 1, 4, and 7 after incubation (green = endogenous GFP expression). Scale bar: 100 μm.
Abbreviations: CS-PCL, cationic chitosan-graft-poly (ɛ-caprolactone); GFP, green fluorescent protein; PCL, polycaprolactone; mRPC, mouse retinal progenitor cell; TCPS, tissue culture polystyrene.

