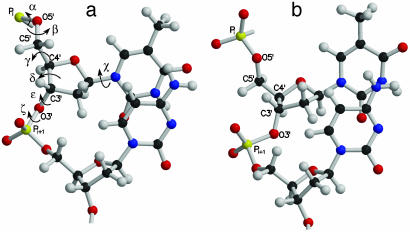
Fig. 2.
Molecular plot of the dinucleotide repeat with BI (a) and BII (b) conformations. The arrows indicate the backbone torsions around the central bond of the nucleotide. The torsions C4′–C3′–O3′–P(ε) and C3′–O3′–P–°O5′ (ζ) favor 210° (trans) and 261° (gauche–), respectively, in a. In b, the values of ε and ζ are 261° (gauche–) and 213° (trans), respectively. Notice the greater stacking of bases in a than in b.

