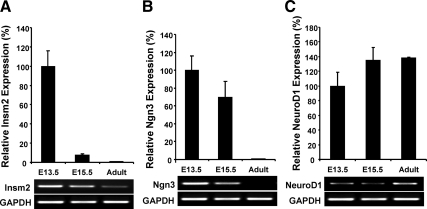
Fig. 6.
Quantitative analysis of Ngn3, NeuroD1, and Insm2 transcripts in fetal and adult mouse pancreas by real-time PCR. Gapdh was used as an internal control. The expression level at E13.5 was defined as 100%, and the level of each gene at E15.5 and in adult pancreas was calculated as the percentage of E13.5. A representative PCR (A, Insm2; B, Ngn3; C, NeuroD1) is shown below each graph.

