Fig. 7.
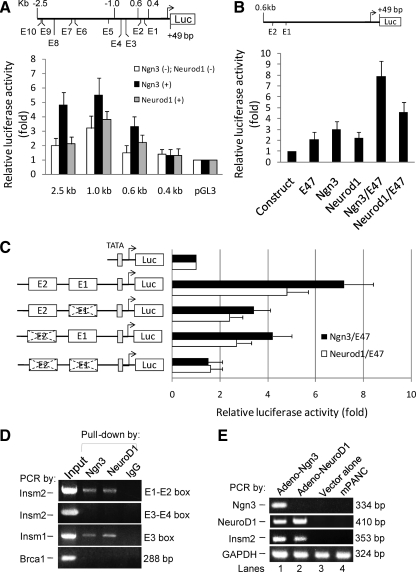
Activation of Insm2 promoter by Ngn3 and NeuroD1. A, Schematic representation of the E-boxes within the proximal −2.5-kb region of Insm2 promoter-driven luciferase (Luc) reporter. Luciferase reporter-gene assays were performed with various lengths of the Insm2 promoter-Luc constructs. HeLa cells were transiently cotransfected with 0.5 μg of each plasmid DNA in the absence or presence of CMV-Ngn3 or CMV-NeuroD1 for 48 h. B, Schematic diagram of two proximal E-boxes in the 0.6 kb of Insm2 promoter-Luc reporter. To test the effects of Ngn3/E47- or NeuroD1/E47-mediated activation on the reporter, 0.5 μg of the plasmid DNA was transfected alone (first lane) or cotransfected with E47, Ngn3, NeuroD1, Ngn3/E47, and NeuroD1/E47 (lane 2–6, respectively) into HeLa cells for 48 h. C, Constructs containing the two proximal E-boxes, either wild type or mutated (×), of the Insm2 promoter and the TATA-Luc reporter were established as shown. Then 0.5 μg of each reporter plasmid DNA was cotransfected into HeLa cells with CMV-Ngn3/E47 or CMV-NeuroD1/E47 reagents. The effects are shown as fold activation over basal values of vectors or constructs (means ± se). Transfection was carried out in triplicates and repeated three times. D, Ngn3 and NeuroD1 bind the Insm2 promoter. ChIP with Ngn3 or NeuroD1 antibodies or IgG was performed on chromatin isolated from MIN6 cells. Input DNA was serially diluted and used as a positive control for PCR analysis. The Insm2 promoter is coimmunoprecipitated using the Ngn3 or the NeuroD1 antibodies but not by the preimmune IgG. The positive control Insm1, but not the negative control Brca1, was specifically coprecipitated by the Ngn3 or NeuroD1 antibodies. E, Ngn3 and NeuroD1 induced endogenous Insm2 expression. Expression of Insm2 was induced in adeno-Ngn3- or adeno-NeuroD1-transduced mPANC cells for 48 h (lanes 1–2), but not detectable from the adenovector-infected cells (lane 3) or parental mPANC cells (lane 4) as determined by PCR. NeuroD1 was also induced in adeno-Ngn3-transduced mPANC cells (second panel, lane 1). GAPDH was the template control (lanes 1–4). Representative images from three separate experiments are shown.

