
Figure 7.
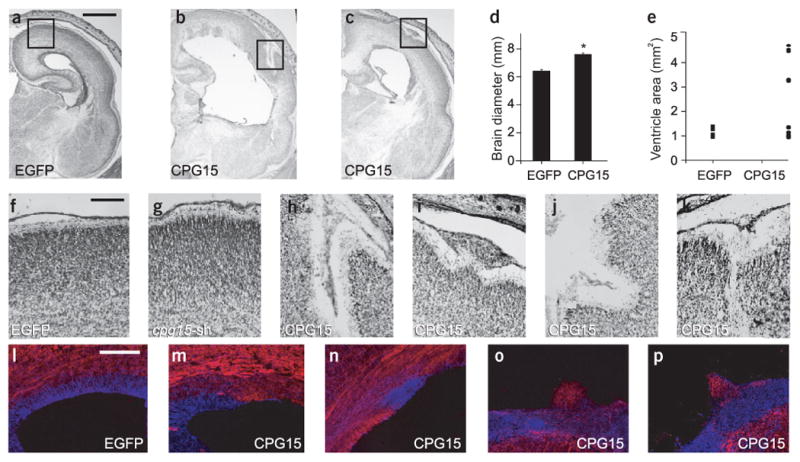
In vivo CPG15 overexpression in the embryonic brain results in an expanded cortical plate and heterotopic cell masses in the ventricular zone. (a–e) CPG15 lentivirus–infected brains are larger in diameter and ventricular area. (a–c) Nissl stained coronal sections from EGFP and CPG15 lentivirus–infected brains. (d) Measurements of brain diameter comparing control and CPG15-overexpressing brains (* P < 0.02). (e) Scatter plot summarizing ventricular area of the same brains. Each symbol represents one hemisphere. (f–k) Nissl-stained coronal sections of brains infected with the indicated viruses. Boxes in (a–c) are shown at higher magnification in f, h and i, respectively. (l–p) Double labeling for nestin in blue and neurofilament in red on EGFP lentivirus–injected (l) and CPG15 lentivirus–injected brains (m–p). Scale bars: a, 1 mm; f, 50 μm; l, 100 μm.