
Figure 5.
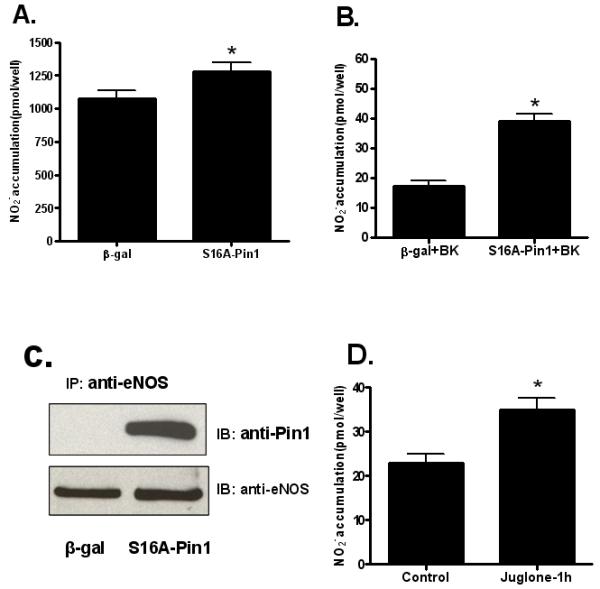
Effects of inhibition of Pin1 on basal and agonist-stimulated NO release from BAECs. A, BAECs were transduced with either an adenovirus expressing β-gal or an adenovirus expressing dominant negative S16A Pin1. After 48 h, basal NO release was measured by quantifying nitrite accumulation in conditioned media using the NO analyzer (means ± S.E., n=6, *P<0.05 vs. control). B, 48 h after transduction with either the adenovirus expressing β-gal or dominant negative S16A Pin1, media were changed and cells were treated with bradykinin (BK, 1 μM for 30 min). Nitrite accumulation following BK treatment was quantified with the NO analyzer (means ± S.E., n=6, *P<0.05 vs. control). C, At the end of the experiment, cells were lysed and lysates were subjected to immunoprecipitation (IP) with anti-eNOS antibody, and immunoblotting (IB) with anti-Pin1 and anti-eNOS antibodies. Results shown are representative of 3 experiments. D, BAECs were incubated without (control) and with 1 μmol/L juglone for 1 h. The amount of NO release during the treatment time was quantified by measuring nitrite levels in the conditioned media using an NO-specific chemiluminescence analyzer (means ± S.E, n=6, *P<0.05 vs. control).