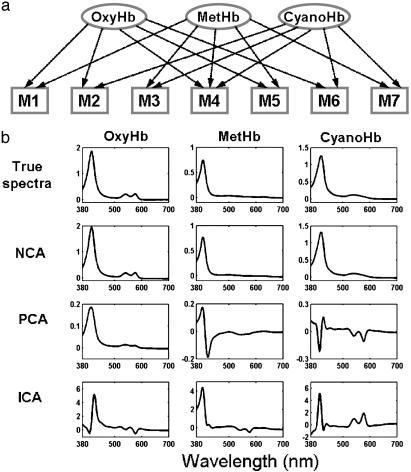
Fig. 3.
Experimental validation of the NCA method using absorbance spectra of hemoglobin solutions. OxyHb, oxyhemoglobin; MetHb, methemoglobin; CyanoHb, cyano-methemoglobin. (a) The connectivity (mixing) diagram of the seven Hb solutions from three pure components that serve as the regulatory nodes. (b) The regulatory signals (pure component spectra) derived from NCA agree well with the true values, whereas those derived from PCA or ICA do not.

