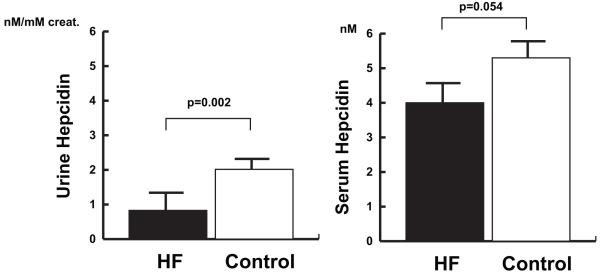
Figure 1. Hepcidin and heart failure.
Bar-graphs demonstrate serum and urine hepcidin levels in all patients with HF compared to control subjects. The left-hand panel compares urine hepcidin levels in patients with HF compared to controls. The right-hand panel compares serum hepcidin levels in patients with HF to controls. Error bars represent standard error of the mean.

