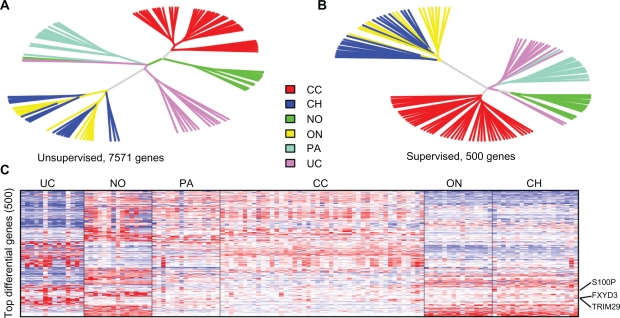
Figure 1.
Unsupervised A) and supervised B) clustering on selected genes. The supervised clustering was based on selected genes most differentiable between the tumor types, while the unsupervised clustering was based on the filtered genes with maximal values of IQR and CV values among the study cohort. Most of the samples were clustered together correctly. UC is shown to have a particularly unique gene expression profile. C) Heatmap of the top differential genes between UC samples and normal references. FXYD3 is one of the top 3 genes shown in the heatmap. The other two are S100P and TRIM29, also shown in the plot.
Abbreviations: No, normal; UC, urothelial; PA, papillary; ON, oncocytoma; CH, chromophobe; CC, clear cell RCC.

