Figure 2.
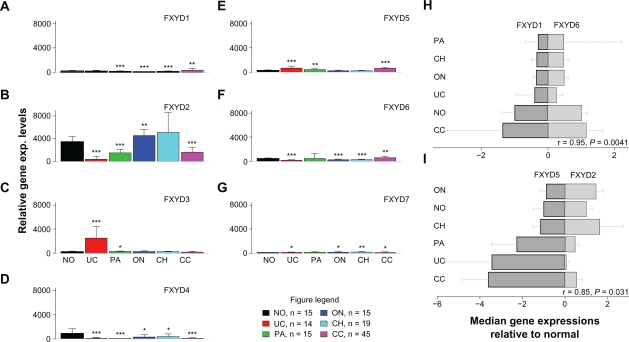
Gene expression profiles of genes in the FXYD family and correlations. (A–G): gene expression profiling of normal and kidney tumors for genes FXYD1-FXYD7. Mean + SD in each group was shown. FXYD3 is the only gene that is UC specific. (H, I): Correlation of FXYD gene expression patterns in kidney tumors. The median values were used in each group. The correlation coefficients (r) and P-values were based on the Pearson method. Standard deviations were added in the plot. H) Significant positive correlation of gene expression patterns was seen between FXYD1 and FXYD6. I) Significant negative correlation of gene expression patterns was seen between FXYD2 and FXYD5. No other pairs in the family were found to be significantly correlated.
Notes: Significance codes: 0–0.001 = ***, 0.001–0.01 = **, 0.01–0.05 = *, 0.05–0.1 = ., 0.1–1 = “ ”.
Abbreviations: No, normal; UC, urothelial; PA, papillary; ON, oncocytoma; CH, chromophobe; CC, clear cell RCC.

