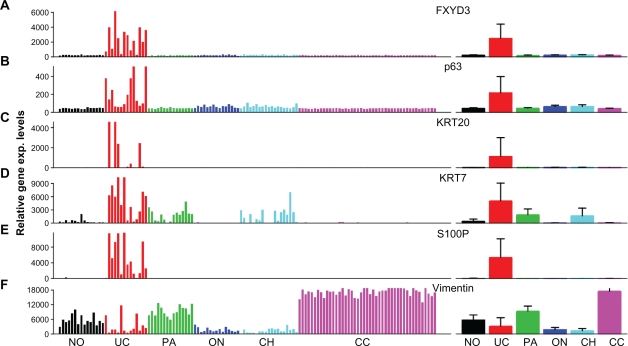
Figure 3.
Gene expression profiling of genes identified to be potential biomarkers. Left: individual gene expression intensity plot. Right: mean intensity + SD plot. A) FXYD3 over expression is highly specific to UC, with at least a 3-fold increase over normal kidney in 13 out of 14 (92.9%) cases tested. B) Overexpression of p63 was detected in 7 of 14 (50%) UC samples. Overexpression is specific to UC, but not as consistent as FXYD3 overexpression. C) Overexpression of keratin 20 (KRT20) in UC. D) Overexpression of keratin 7 (KRT7) in UC. E) Overexpression of S100P was detected in 12 of 14 (85.7%) UC samples. Overexpression is highly specific to UC, comparable to FXYD3 overexpression. F) Vimentin was down regulated in the majority of UC cases, whereas it was up regulated in most clear cell and papillary RC cases. However, down-regulation was also observed in most chromophobe RCC and oncocytoma cases, limiting its use as a UC specific biomarker.
Abbreviations: CC, clear cell; PA, papillary; ON, oncocytoma; Ch, chromophobe; No, normal; UC, urothelial carcinoma.

