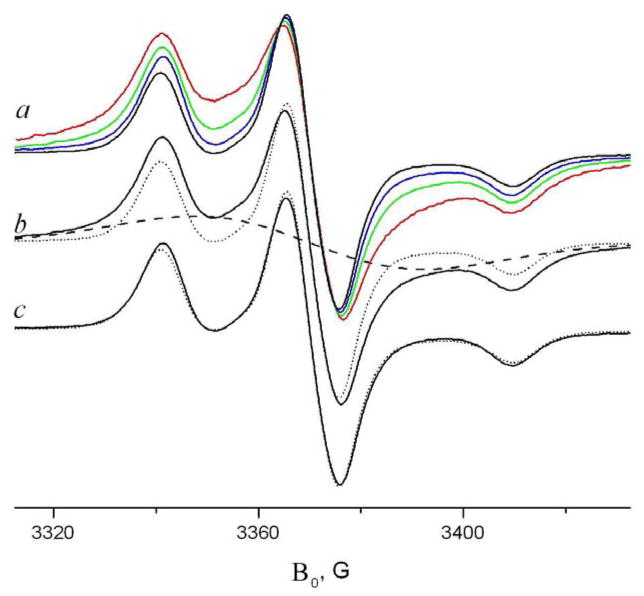
Fig. 10.
a) Concentration dependence of GADL spectrum in DPPC at 77K, % mol: 2% (red), 0.5% (green) 0.1% (blue) 0.1% GADL +1.9% GD (black) b) analysis of the spectrum with 0.5% GADL by separating the broad signal. The solid line is 0.5% GADL in DPPC, dashed line is a Gaussian approximation for the broad signal. c) solid line is the subtraction of the Gaussian approximation from the experimental spectrum. Both dotted lines (b, c) are 0.1% GADL + 1.9% unlabeled GD in DPPC

