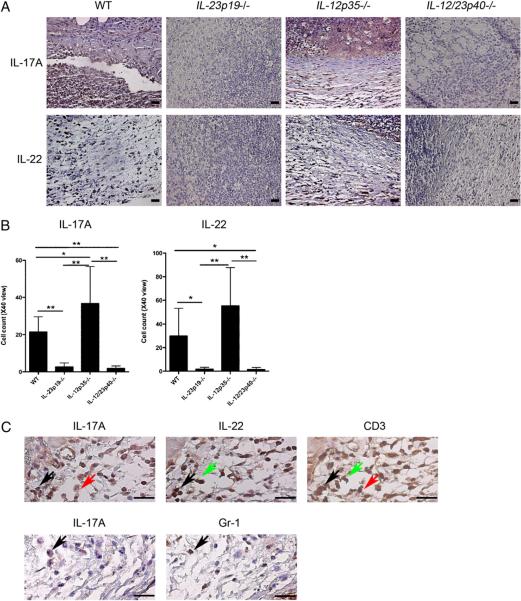
FIGURE 5.
Impaired protein production of IL-17A and IL-22 in IL-23–deficient mice. A, Anti–IL-17A Ab-stained or anti–IL-22 Ab-stained sections of skin 4 d postinfection with C. albicans. Original magnification ×40; scale bars, 0.025 mm. B, Quantification of IL-17A+ and IL-22+ cells in each of the four groups of mice shown in A. Bar graphs were analyzed using Kruskal–Wallis test and Scheffe's F test. IL-17A: *p < 0.05; **p < 0.01 versus WT. IL-22: *p * 0.05; **p < 0.001 versus WT. C, IL-17A, IL-22, and CD3, or IL-17A and Gr-1 staining of serial sections of WT mouse skin 4 d postinfection with C. albicans. Original magnification ×100; scale bars, 0.025 mm. Black arrows indicate cells positive for IL-17A, IL-22, and CD3 (top panels) and cells positive for IL-17A and Gr-1 (bottom panels). Green arrows indicate cells positive for IL-22 and CD3, but negative for IL-17A. Red arrows indicate cells positive for IL-17A and CD3, but negative for IL-22.

