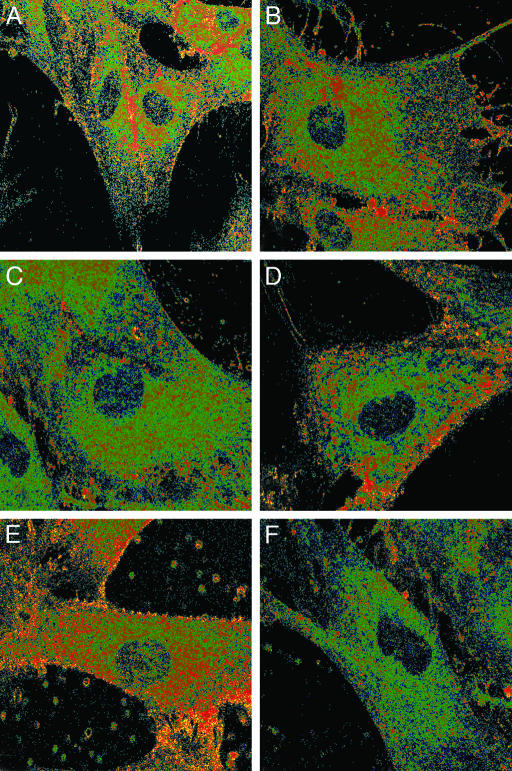
Fig. 2.
GP images of fibroblasts. GP image of living (A) or fixed (B) fibroblasts (4% paraformaldehyde, 30 min, 4°C) were obtained as described for macrophages. Cells were treated with 10 mM mCD for 1 h at 37°C (C), nonspecifically crosslinked with 0.5 mM BS3 (D), or patched with anti-transferrin receptor and secondary antibodies (E). For F, fibroblasts were first mCD-treated and then antibody patched. The same pseudocoloring as in Fig. 1 was used. The widths of the images are 114.0 μm(A), 89.1 μm(B), 79.7 μm(C), 59.1 μm(D), 66.5 μm (E), and 73.2 μm (F).

