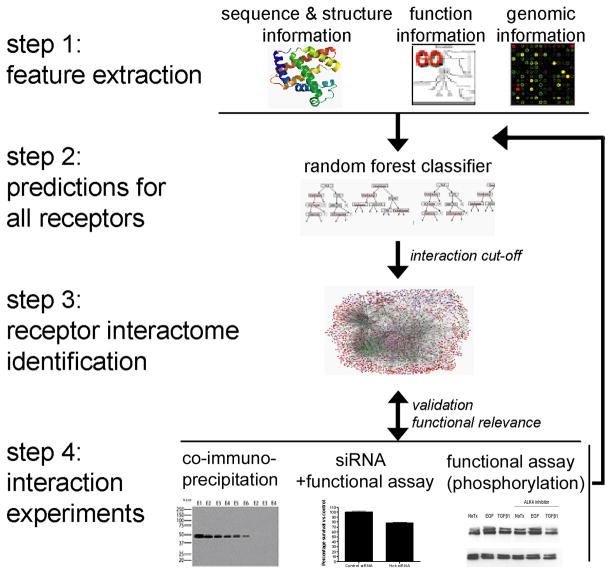
Figure 1. Illustration of our combined computational-experimental approach to investigate the human membrane receptor interactome.
Step 1. Feature Extraction. Features were collected from diverse data sources, including sequence information, gene expression, functional annotation, tissue location, homologous interactions, and domain based association evidence. Step 2. Prediction for all receptors. Evidence was integrated using a random forest classifier for protein-protein interaction prediction. The random forest is an ensemble classifier and uses a collection of decision trees to model the relationship between multiple evidence and protein interactions. Step 3. Receptor interactome identification. Receptor interactome was defined as described in ‘Methods’. Visualizations were done with Cytoscape [54]. Nodes are drawn in different colors, with green representing type I receptors, blue for GPCR, pink for ligands and red for other human gene products. Step 4. Interaction validations. Specific pairs with high likelihood of interaction based on random forest score were validated experimentally.

