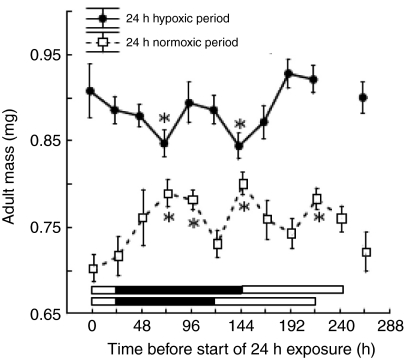
Fig. 4.
CD experiments. Top graph: CD experiments in which male D. melanogaster were reared in 21 kPa PO2 except for a 24 h period of 10 kPa PO2. Bottom graph: CD experiments in which flies were reared in 10 kPa PO2 except for 24 h of 21 kPa PO2. The x-axis labels indicate the number of hours after egg laying. The separate right-most data points, are from flies that were reared in either 21 kPa PO2 (top) or 10 kPa (bottom) PO2 continuously throughout their entire development. Adult flies were weighed 2 weeks after egg laying. Any values marked with an asterisk are significantly different from the constant normoxia (top right-most data point) or constant hypoxia (bottom right-most data point) groups by an a priori test with a Bonferroni-corrected P-value. The typical developmental timeline of the experimental flies was: 0–24 h, embryonic stage (left-most white bar at bottom); 24–96 h, larval stage (black bar at bottom); 96–192 h, pupal stage (right-most white bar).

