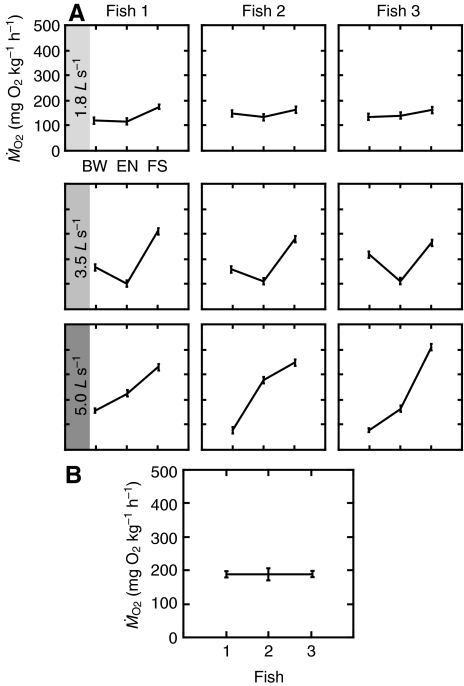
Fig. 3.
(A) Patterns of oxygen consumption differ across speed, but remain consistent across individuals. Individual variation in the rate of oxygen consumption ( ) was less at 1.8 L s–1 and 3.5 L s–1, but higher at 5.0 L s–1. This observation may be partially attributed to lower fidelity to a cylinder region at lower flow, which results in a homogenization of
  values. (B)
  patterns were not dominated by any one individual as there is no significant individual effect on
  value. BW, bow waking; EN, entraining; FS, free stream swimming. Values are means ± s.e.m.

