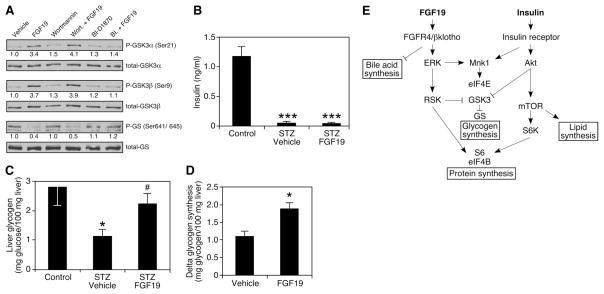
Fig. 4.
FGF19-induced glycogen synthesis is independent of insulin. (A) Overnight serum-starved HepG2 cells were pretreated with vehicle, wortmannin (200 nM), or BI-D1870 (10 μM) for 1 hour. The cells were lysed 30 min after vehicle or FGF19 (250 ng/ml) treatment. Proteins were identified by Western blotting with the indicated antibodies. Numbers below blots represent fold-change relative to the vehicle group. (B and C) Mice were treated i.p. with STZ (175 mg/kg). Eight days later, diabetic animals were chosen and treated with vehicle or 1 mg/kg FGF19 i.p. at 6 p.m. for seven consecutive days, and killed 6 hours after the last injection at 8 a.m.(n = 5 to 9). Liver glycogen content and plasma insulin levels were determined. *P < 0.05 is between control and STZ-vehicle groups; #P < 0.05 is between STZ-vehicle and STZ-FGF19 groups. (D) Three-hour hyperglycemic clamp study was performed on rats fasted overnight (n = 5 to 7). Animals were continuously infused with insulin and somatostatin to maintain low levels of insulin and glucagon and variably infused with glucose to maintain hyperglycemia. Net glycogen synthesis was determined by assessing the glycogen content in the clamped animals subtracted by the glycogen content of unclamped animals that were killed after the same duration of fasting. (E) Insulin and FGF19 act through different signaling pathways to coordinate overlapping but distinct postprandial responses in liver. (B, C, and D) Values are means ± SEM. Statistics by two-tailed t test. *P < 0.05, ***P < 0.0005.

