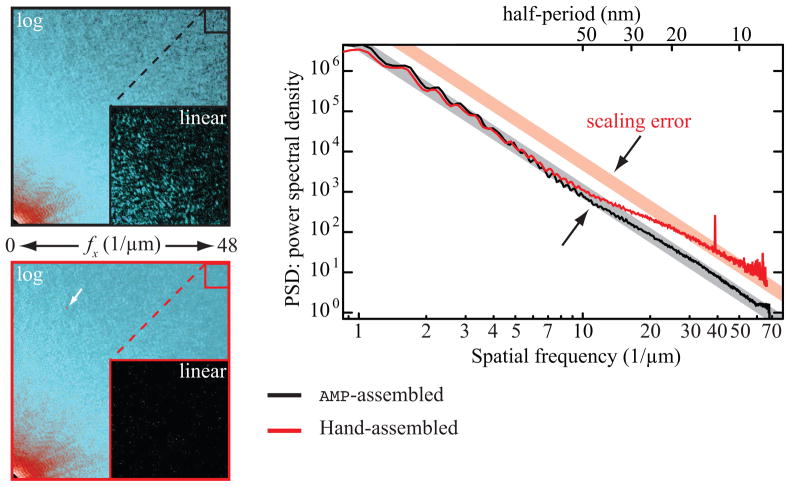
Fig. 1.
Assembled diffraction intensities of data collected on a freeze-dried labeled yeast cell. On the left, the same quadrant of the entire array is shown on a false color logarithmic scale for both AMP-assembled data (in black) and data assembled by hand (in red). An inset shows the highest spatial frequencies of the merged intensities on a false color linear scale. The AMP-assembled intensities show good contrast for speckles all the way to highest spatial frequencies where the hand assembled intensities are dominated by noise. On the right, the power spectral densities for both arrays are plotted on a log-log scale. The hand-assembled data does not follow a straight power law indicating scaling errors between low and high spatial frequency data. The peak at 40 μm−1 in the PSD of the hand-assembled data is due to a cosmic ray; its location is indicated by the white arrow.

