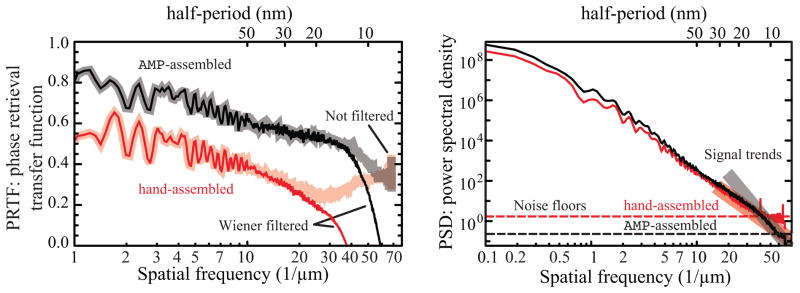
Fig. 4.
The use of a Wiener filter provides an improved measure of reconstructed image quality. This figure shows the phase retrieval transfer function (PRTF; shown in thick shaded lines at left) and power spectral density (PSD; right) curves corresponding to the reconstructions of Fig. 2. In the PSD curves, the square of the spatial-frequency-independent noise floor value |N|2 is shown by a dashed line, and a linear fit to the square of the high spatial frequency trend of the measured signal |C(f)|2 is shown with a thick shaded line. A Wiener filter function was then calculated according to Eqs. 11 and 12 and applied to the PRTF curve, leading to the Wiener-filtered PRTF curve or wPRTF curve which is shown in thin, non-shaded lines at left. Applying the Wiener-filter suppresses the artificially high PRTF-values of the hand-assembled reconstructed data (red) above a spatial frequency of about 25 μm−1 and underlines the higher quality of the reconstruction of the AMP-assembled data.

