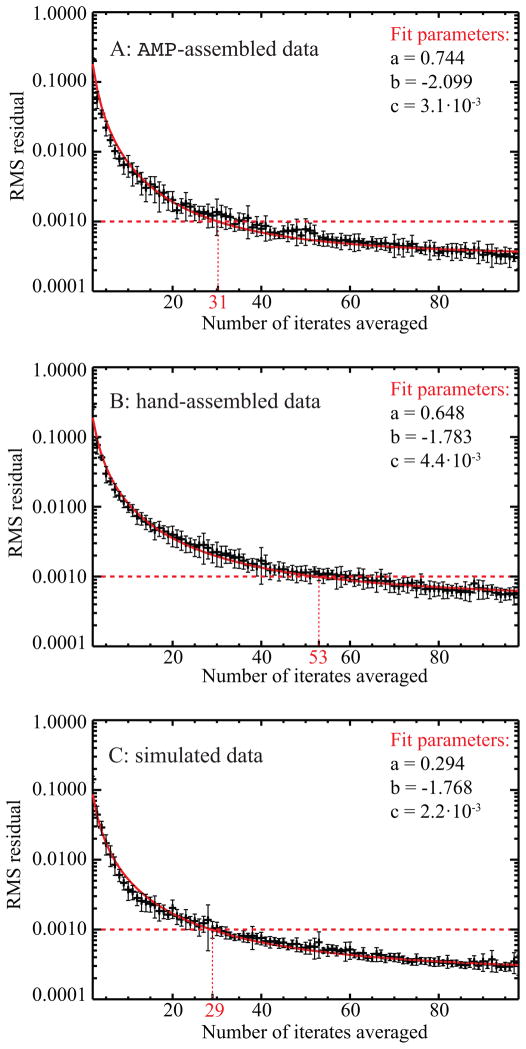
Fig. 7.
Changes in the wPRTF as a function of number of iterates averaged for A) AMP-assembled experimental data, B) hand-assembled experimental data, and C) simulated data. The RMS residual changes in the wPRTF (calculated using Eq. (13)) as one goes from i to i + 1 iterates averaged were then fitted to a function of the form y(x) = axb + c, plotted in red. The error bars indicate the standard deviation between 12 different averaging frequencies. A horizontal dashed line marks a value of RMS residual of 0.001 selected to compare the results for the three different data sets. Not surprisingly, the simulated data with no systematic errors converges most quickly with only 29 iterates averaged, while the higher quality AMP-assembled experimental data requires 31 iterates averaged and the hand-assembled experimental data requires 53 iterates averaged.

