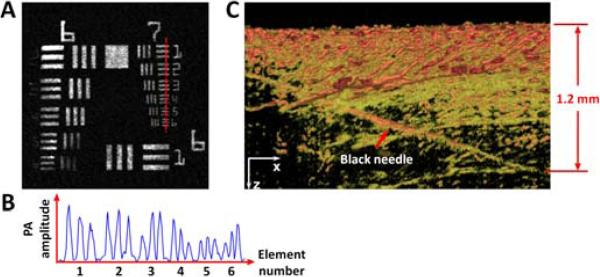
Fig. 3.
(Color online) Spatial resolution and in vivo tissue penetration of G2 OR-PAM. (A) OR-PAM image of an Air Force resolution test target. (B) The cross-sectional profile of the 6 elements in group 7 of the resolution target, as indicated by the red dashed line in (A). (C) OR-PAM image of a black needle inserted obliquely in a living mouse leg. PA: photoacoustic.

