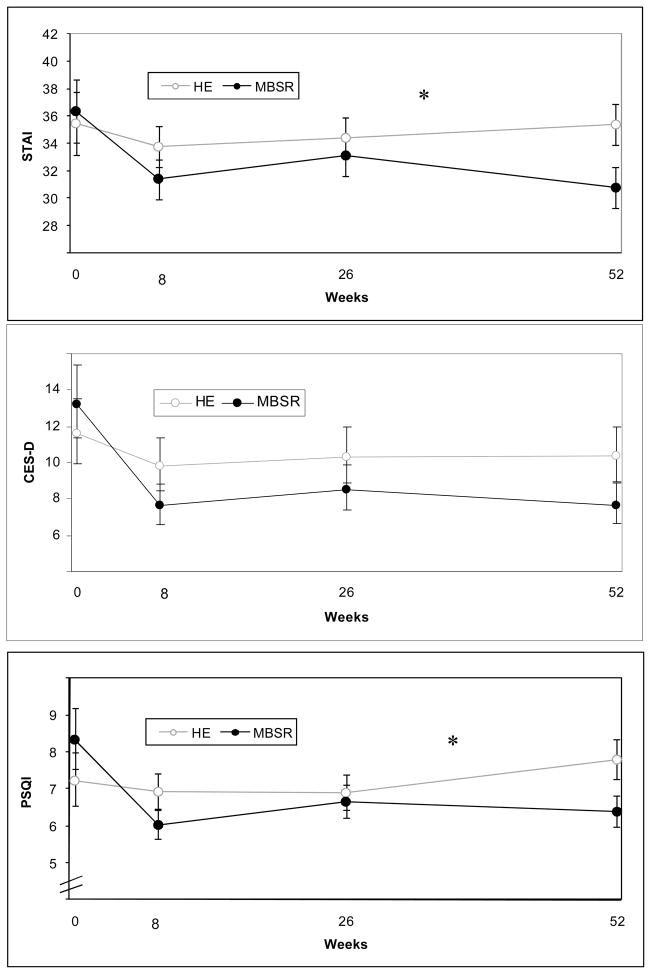
Figure 2.
Trajectory of symptoms over time.
Figure 2a. Anxiety symptoms over time in MBSR and Health Education groups.
Figure 2b. Depression symptoms over time in MBSR and Health Education groups.
Figure 2c. Sleep symptoms over time in MBSR and Health Education groups Means (± SE) over time for STAI (anxiety), CESD (depression) and PSQI (sleep) scales are plotted for the MBSR and Health Education (HE) groups in the intention-to-treat sample after Randomization 2, without imputation of missing values (MBSR, n=63; HE, N=59). Asterisks indicate significant between group differences: the MBSR group reported fewer symptoms of poor sleep and anxiety over time (Ps=0.02, both) than the Health Education group. The difference between groups in depression trajectories was not significant (P=0.10). Values were calculated using linear mixed models with adjustments for baseline value, course cycle, randomization strata, prior waitlist service, interaction between time and treatment impact, and intra-correlations among repeated measurements within subjects and among subjects within a course cycle.

