Figure 3.
Treatment effects versus the Waitlist
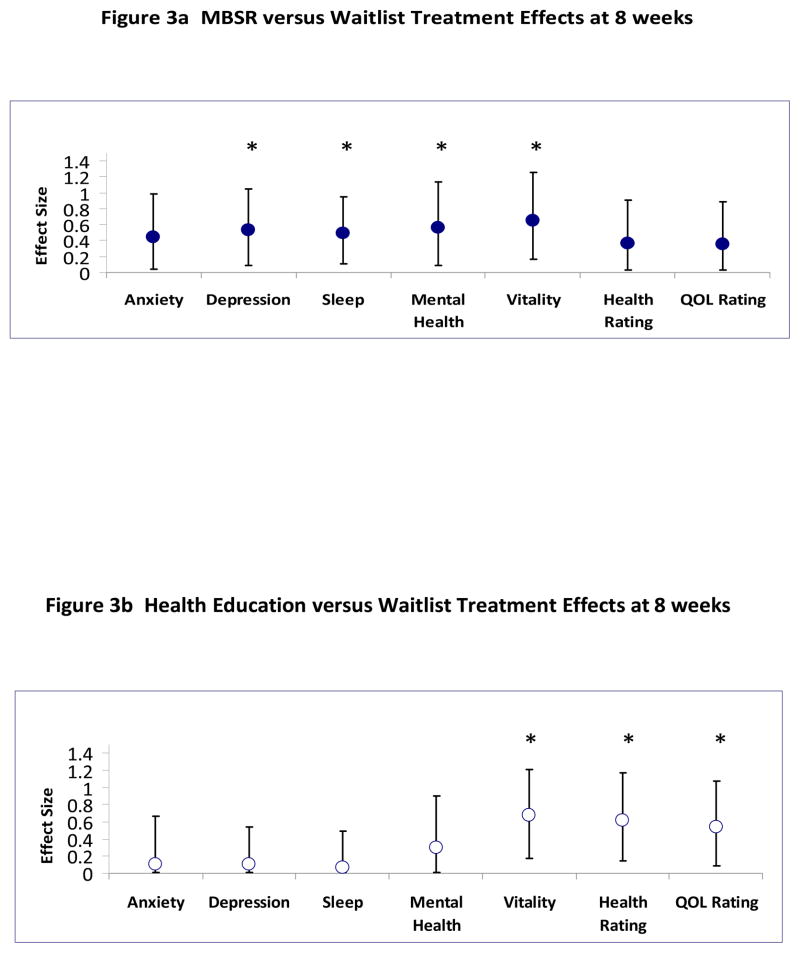
Figure 3a. Treatment effects for MBSR group versus the Waitlist.
Figure 3b. Treatment effects for Health Education versus the Waitlist.
Effect sizes at 8 weeks from generalized linear models with adjustments for baseline values and randomization strata in the intention-to-treat sample after Randomization 1, without imputation of missing values (MBSR, n = 47; Waitlist, n = 29; and Health Education, n=41). Effects significantly different from 0 are indicated by an asterisk. The Physical Health Summary and SF-36 Pain subscale had small non-significant treatment effects (<0.20), and are not shown.

