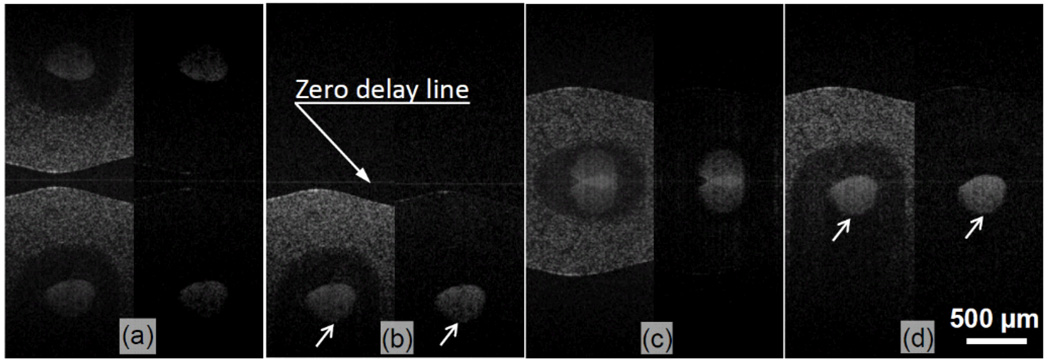
Fig.2.
OCT structural and OMAG flow images resulted from a flow phantom. Each figure consists of a pair of images with the structural image on the left and the flow image on the right. (a) and (c) are the results from the conventional approach, and (b) and (d) are the corresponding results from the FRC imaging approach.

