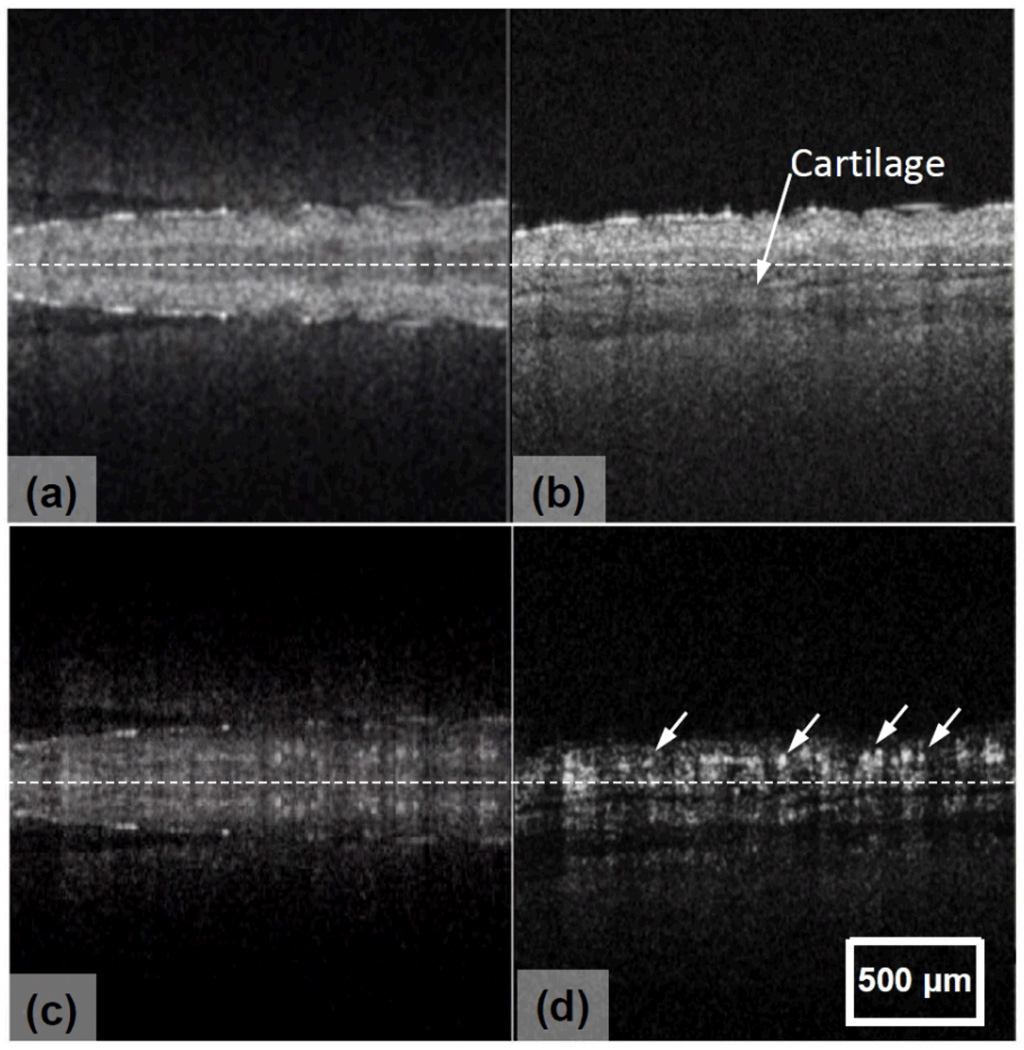
Fig.3.
A mouse ear imaged in vivo by: (a) conventional and (b) FRC OCT imaging of microstructures, and the corresponding (c) conventional and (d) FRC UHS-OMAG imaging of blood flows. Note that the images are truncated to remove the top and bottom parts that do not contain useful information. Dashed line indicates the zero-delay line.

