
Figure 4.
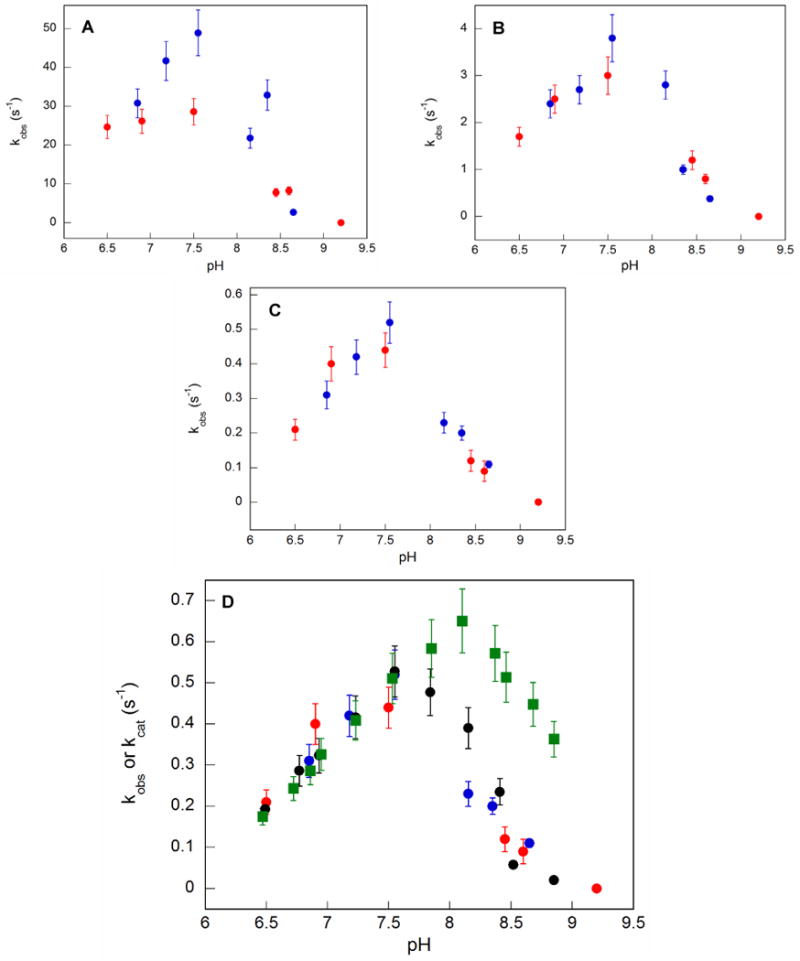
pH rate profiles for NH2Y• formation in the reactions of NH2Y730-α2 (blue dots) or NH2Y731-α2 (red dots) with F3Y356-β2 in the presence of CDP/ATP. pH dependence of the rate constants from the 1st (A), 2nd (B) and 3rd (C) kinetic phases determined from the tri-exponential fits (Table 1). In (D), the data from panel (C) are overlaid with the pH rate profiles for [14C]-dCDP formation with F3Y356-β2/wt α2 (black dots) and with intein wt-β2/wt α2 (green squares), determined in a previous study (18).