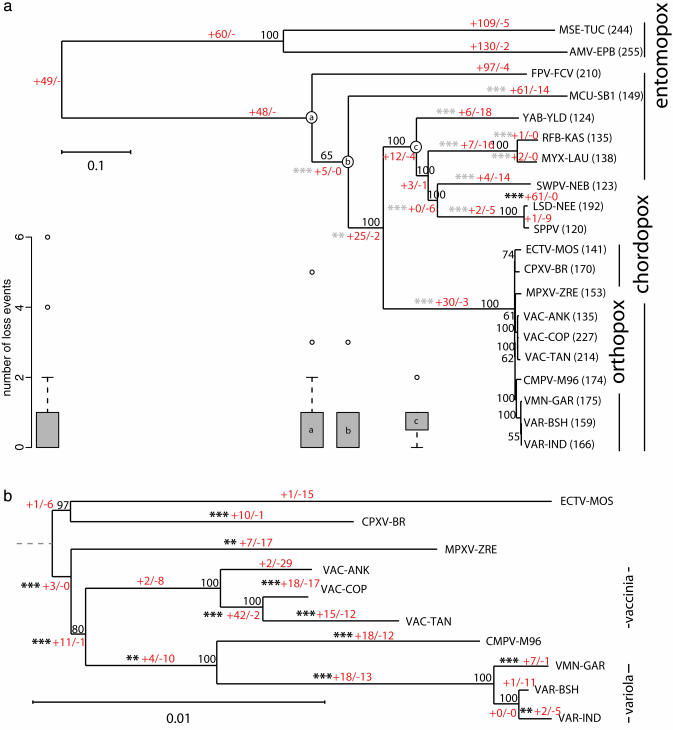
Fig. 1.
NJ trees of the poxviruses. The classifications of the viruses are indicated to the right. Bootstrap values are shown for each branch. The numbers in red separated by/are the number of gain and loss events, respectively that occurred along each branch. At the base of the phylogeny it is not possible to distinguish a gaininone lineage from a loss in the other. In these cases the events were counted as gains and we use a lone hyphen (-) in place of a count of loss events to indicate this fact. *** indicates that the number of gains was significant at the 1% level, and ** indicates significance at the 5% level (see Methods). Gray and black asterisks indicate the number of events were below or above expectations, respectively. (a) NJ tree of all completely sequences poxviruses, based on 34 gene families. The number of genes from each genome that were assigned into families is shown after the genome name. The box plots show the distribution of the number of loss events in families dating back to the node of the tree above (indicated by a labeled circle). Only box plots with outliers are shown. The leftmost box plot refers to families ancestral to all poxvirus genomes analyzed. (b) NJ tree of the orthopoxviruses, based on 92 gene families. The dashed line shows the approximate position of the root of the orthopoxviruses inferred from tree a.

