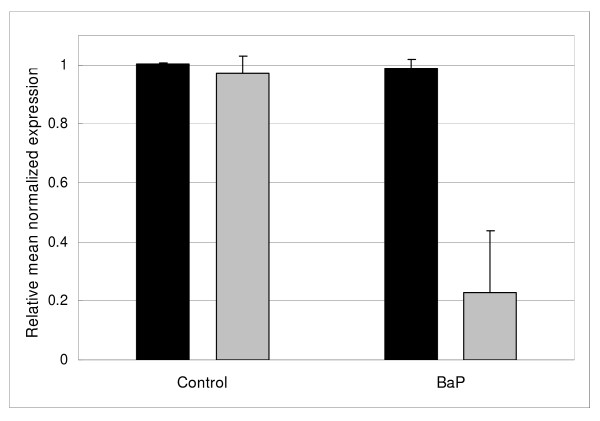
Figure 3.
Silicon transporter 1 gene regulation. Bar graph shows the normalized expression mean of the sit1 gene (gray) relative to the expression of a housekeeping gene gapdh (black) by qRT-PCR. Total RNA extracted from benzo(a)pyrene-exposed (BaP) and control diatom cultures has been tested for a total of 6 different biological replicates. The bars represent the standard deviation among the different replicates.

