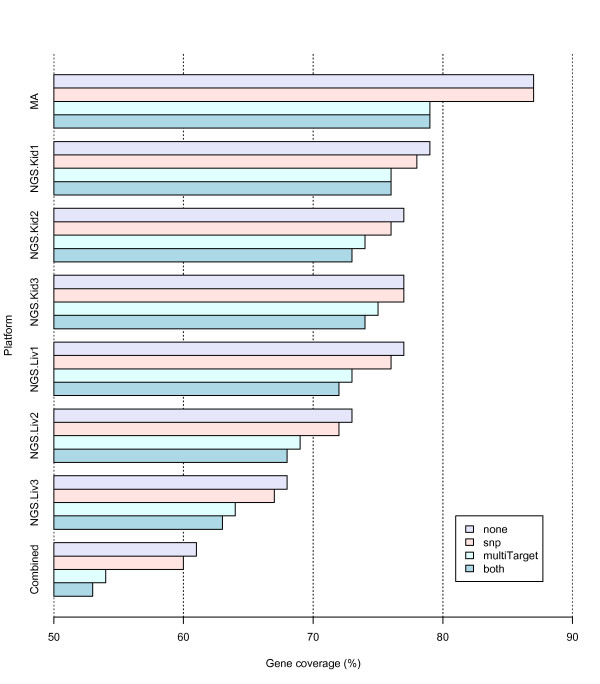
Figure 6.
Gene coverage. Gene coverage per platform is displayed with different exclusion feature settings. The coverage was calculated using the RefSeq transcriptome database as a reference, which had a total of 21,505 genes. Each platform had 4 coverage values obtained from the corresponding exclusion features: 'none' = apply no exclusion feature, 'snp'= remove tags containing SNPs, 'multiTarget' = remove tags matched to more than one target, and 'both' = apply both 'snp' and 'multiTarget'. Both microarray (MA) and next-generation sequencing (NGS) had replicates from two tissues: kidney (Kid) and liver (Liv). The coverage that resulted from applying all filters is shown at the bottom of the graph (Combined).

