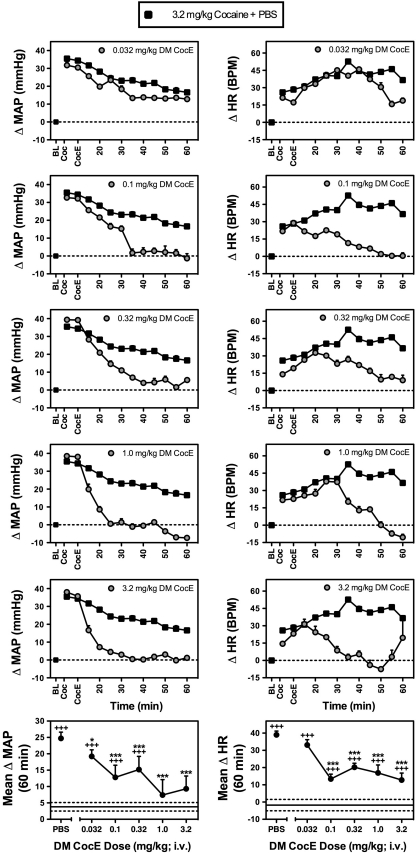
Figure 3.
Effects of DM CocE (0.032, 0.1, 0.32, 1.0, and 3.2 mg/kg; i.v.) on the cocaine-induced changes in mean arterial pressure (MAP; left panels) and heart rate (HR; right panels) when administered 10 min after a dose of 3.2 mg/kg i.v. cocaine in a representative monkey (F1). Data points represent the mean±SEM change from baseline for MAP or HR over successive 5-min blocks of time during the first 60 min after cocaine administration, and are compared with the effects observed when PBS followed 3.2 mg/kg i.v. cocaine. Dose-response curves for the effects of DM CocE on the mean change in MAP and HR obtained during the 60-min period following cocaine administration. Horizontal lines represent the mean (solid)±SEM (dashed) change in MAP or HR obtained during the saline+PBS condition. *p<0.05; ***p<0.001; +++p<0.001. Significant difference from saline+PBS (+) or the 3.2 mg/kg cocaine+PBS (*) condition as determined by a one-way ANOVA with post hoc Newman–Keuls tests.

