
Figure 3. XAV939 treatment from day 3 to 5 of ES cell differentiation strongly induces cardiomyogenesis.
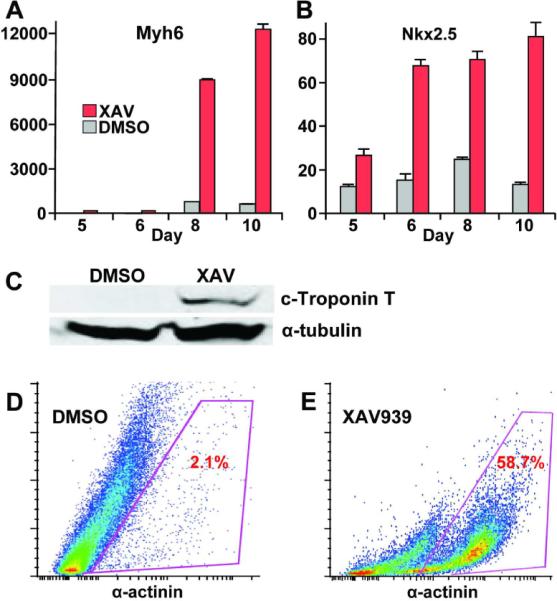
(A, B) XAV treatment led to huge increase in expression of cardiac markers Myh6 and Nkx2.5. Q-PCR results represent relative expression normalized to that of DMSO-treated cells at Day 0. Measurements were obtained from at least three independent experiments for each time-point. Red bars, XAV939-treated. Gray bars, DMSO-vehicle treated. P-values for Myh6 expression at day 8 and 10 following XAV treatment were both <0.0001, in comparison to DMSO-vehicle treatment as negative controls. P-values for Nkx2.5 expression at day 8 and 10 following XAV treatment were 0.0004 and 0006, respectively, in comparison to DMSO treatment. (C) Western blot showing much higher levels of the cardiac Troponin T protein in XAV-treated ES cells on day 10 in comparison to DMSO-treated controls. Antibody against α-tubulin was used as loading control. (E) Representative FACS analysis showing an approximately 28-fold increase in the fraction of α-actinin+ cells following XAV939 treatment vs. DMSO controls.