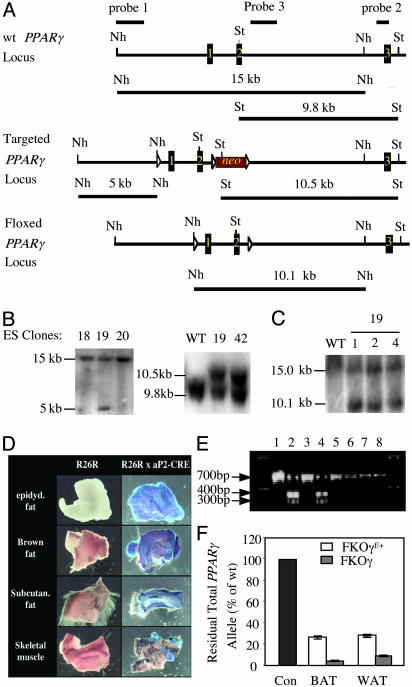
Fig. 1.
PPARγ targeting strategy and aP2-Cre transgene activity. (A) Shown (top to bottom) are the wt, targeted, and floxed pparγ gene loci. Probes 1–3 were used to identify recombinants. Sizes and positions of detectable restricted fragments are shown. (B) Southern analysis of targeted ES cells. (Left) Hybridization with 5′ probes. (Right) Hybridization with 3′ probes (C) Southern blot with probe 3 of ES cells transiently transfected with a Cre plasmid. (D) 5-Bromo-4-chloro-3-indolyl β-d-galactoside staining of BAT, WAT, skin, and skeletal muscle from ROSA26 Con and ROSA/aP2-Cre mice. (E) Detection of wt and mutant PPARγ1 mRNA by RT-PCR. Lane 1, wt BAT; lane 2, FKO BAT; lane 3, wt WAT; lane 4, FKO WAT; lanes 5–8, FKO macrophages, heart, skeletal muscle, and liver, respectively. Arrows indicate the wt (700-bp) and mutant (300- and 400-bp) PCR products. (F) Southern blot of DNA from BAT and WAT of FKOγfl/+ and FKOγf/f. Recombination efficiencies are depicted as residual total PPARγ allele relative to wt.

