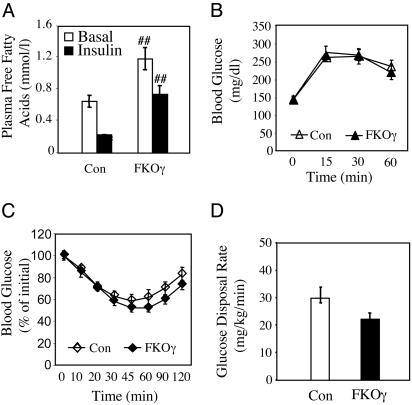
Fig. 3.
FKOγ mice show relatively normal insulin sensitivity. (A) Blood FFA levels in basal state and during clamp. Values from each group are the mean ± SEM (n = 8). *, P < 0.05, basal vs. clamp; ##, P < 0.01, FKOγ vs. Con. Glucose tolerance (B) and insulin tolerance (C) tests in Con and FKOγ mice. Values are the mean ± SEM (n = 10). (D) Insulin-stimulated muscle glucose uptake during clamp. Values are the mean ± SEM (n = 8).

