Figure 4.
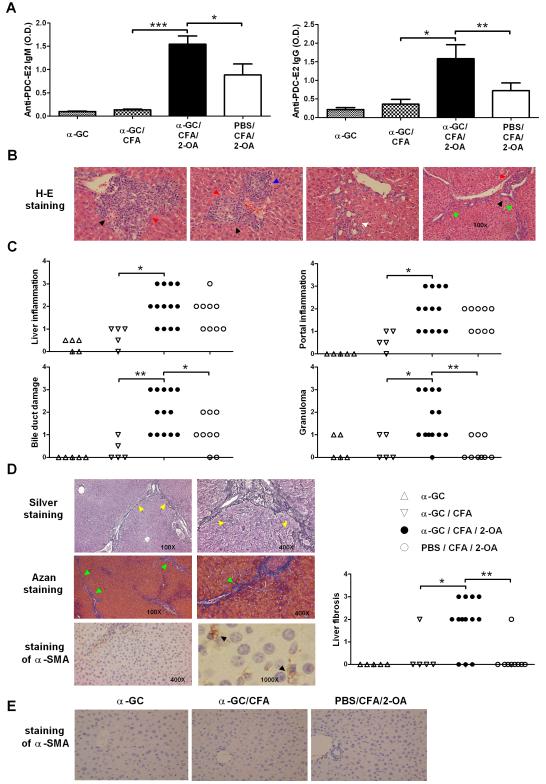
Activation of iNKT cells by α-GalCer in 2-OA-BSA immunized mice exacerbates autoimmune cholangitis. Mice were immunized as described and sacrificed at week 12. (A) Serum levels of autoantibodies to PDC-E2 were measured by ELISA (1:400 sera dilutions). O.D., optical density. Results are expressed as mean ±SEM. n=10 mice per group. *, p<0.05; **, p<0.01; ***, p<0.005. (B) Representative results of histopathologic examination of liver sections of α-GC/CFA/2-OA mice (left three panels, x400 magnification; right panel, x100 magnification). Portal inflammation is shown with red arrows. Bile duct damage is shown with black arrows. Granulomas are shown with blue arrows. Proliferating bile ductules are shown with white arrows. Fibrous septa extension is shown with green arrows. (C) Histopathological scores of individual livers. 0 = no significant change, 1 = minimal, 2 = mild, 3 = moderate, and 4 = severe pathology. (D) Silver staining and Azan staining are used to highlight fibrous septa extension (yellow arrows and green arrows, respectively). The brown color in α-SMA staining indicates α-SMA positive cells. Liver fibrosis scores: 0 = no significant change, 1 = minimal, 2 = mild, 3 = moderate, and 4 = severe pathology. (E) α-SMA staining of liver sections in α-GC, α-GC/CFA, and PBS/CFA/2-OA mice.

